— Sloth Boss
Authentication Required
Permission Required
The NØTWORK
Powered by
Main
Home
Help
Explore
Explore
Mastery
Compete
Leaderboard
Rewards
Toggle Sidebar
Back
Data Science
Article on Why Data Visualization Is Critical
Article
Base
Description
Mark as Complete
Like
Bookmark
Share
scientificamerican.com
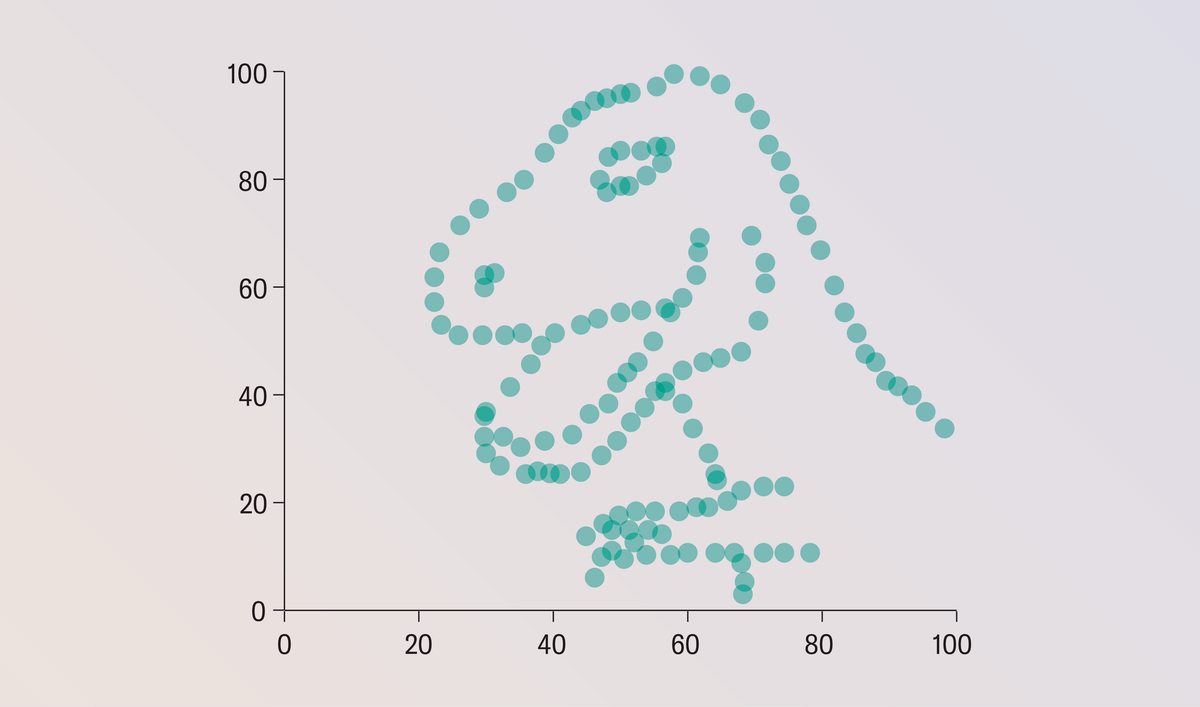
What This Graph of a Dinosaur Can Teach Us about Doing Better Science
“Anscombe’s quartet” and the “datasaurus dozen” demonstrate the importance of visualizing data
View Content